

Tool: Ehler Charts
Tool: Ehler Charts
Visualising two assets performance differently.
Hello. It's good to have you here.
Executive Summary
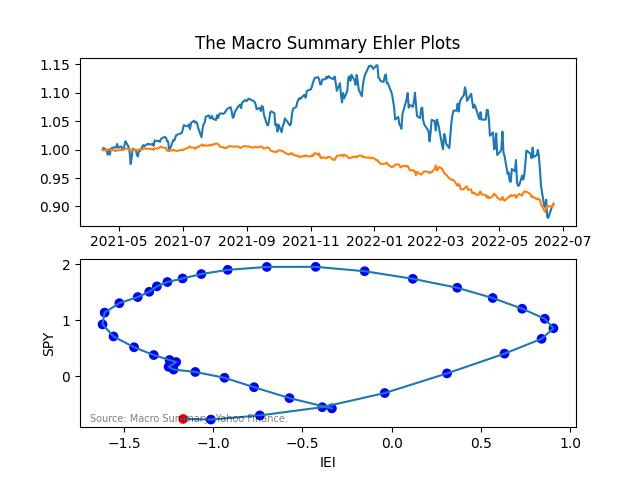
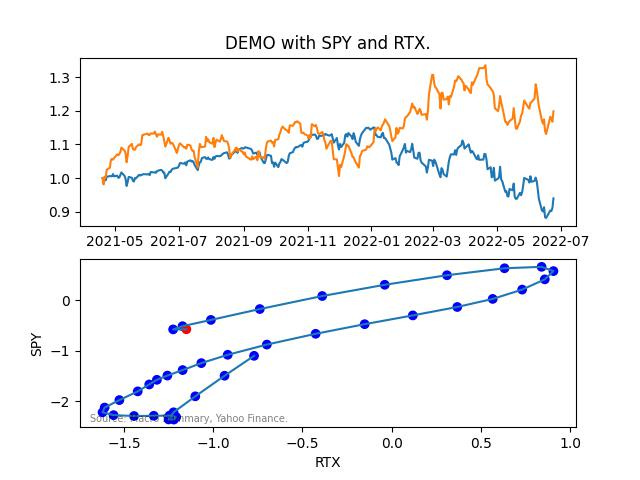
This is the next investment tool that I am happy to publish. While it is part of the technical analysis family, it still can bring valuable information to investors. Ehler Loops or Ehler Charts are a different way to plot two assets performances against each other, making them interesting for pairs-trading strategies. The following tool published on the Macro Summary’s Github Repository is a published python implementation.
Introduction: Ehler Charts
This tool is the python implementation of the Ehler Charts. Additional chart views are not specific investment triggers, however they are helpful visualizations to support investment theses. John F. Ehlers, who is the inventor of the originally named “Ehlers Loops”, has done much research on market cycles.
The Tool:
Ehlers Loops are a pairs trading tool. Some proposed it also instead of price against price, to use it on a single asset, price against volume. Ehlers idea was to switch between stock and index based on the loop direction and XY-value. On clockwise rotations one should go long the stock and short the index from 5 to 10 on a imagined clock face. Short the stock and buy the index from 11 to 4. Be flat when the dots are between 4 and 5, and between 10 and 11 be invested in both assets.
The Data
The tool relies on the data provided by yahoo finance and utilises the package yfinance by Ran Aroussi (PyPI: yfinance). You can therefore load any symbol you can find on yahoo finance (Yahoo Finance). The tools chart goes back 40 periods, which can be adapted in the code (line 189 and 190 change the number in the .tail( )).
How to execute
The package can be imported and the class called with the relevant parameters into any project. The following is going to be the stand-alone execution using the terminal or command console.
Run: python ehler-charts.py
Then enter all requested details, where symbol can be any symbol on yahoo finance. Do not leave any request empty, otherwise the program exits.
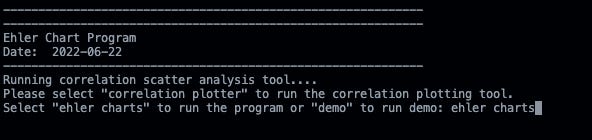
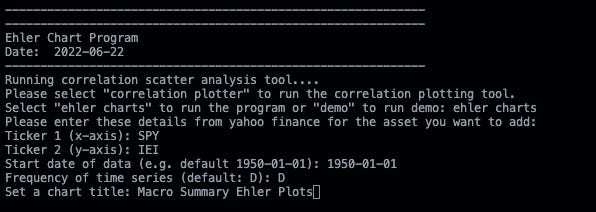
You can also enter spreads like XOP/SPY or TLT-IEI.
Check the tool out for yourself on the Macro Summary Github Page:
Risks and limitations of the tool
The tool is based on limited quality data and calculation. It is not accurate and cannot be used for investment decisions. The tool is only there to provide a rough idea on possible relative performance.
This tool has not been backtested in a systematic trading strategy. While this might be an interesting endeavour for the future, this tool is only for visualisation and makes no claim about asset performance or its reliability in a trading strategy.
Yahoo data is error prone: Yahoo data is error prone and can lead the program to calculate wrong performance.
Specific data (e.g. Futures roll): Yahoo data is not cleaned for futures roll.
This tool is hopefully a good addition to your analysis technique and provides you with helpful insights. If you have suggestions for improvement, please feel free to share them.