

Tools: The Seasonality Plotter
Tools: The Seasonality Plotter
A quantitative look on seasonalities now available for Python on GitHub.
Hello. It is good to have you here.
Over the years I developed many python-based market research tools, analysis and backtests. After being asked about them, I decided to make some of them available to the public.
Introducing: The Seasonality Plotter

This tool was developed to assess seasonalities of assets. While seasonalities should not used to make investment decisions, they can be helpful to support a thesis or point to eventual risks.
The Tool
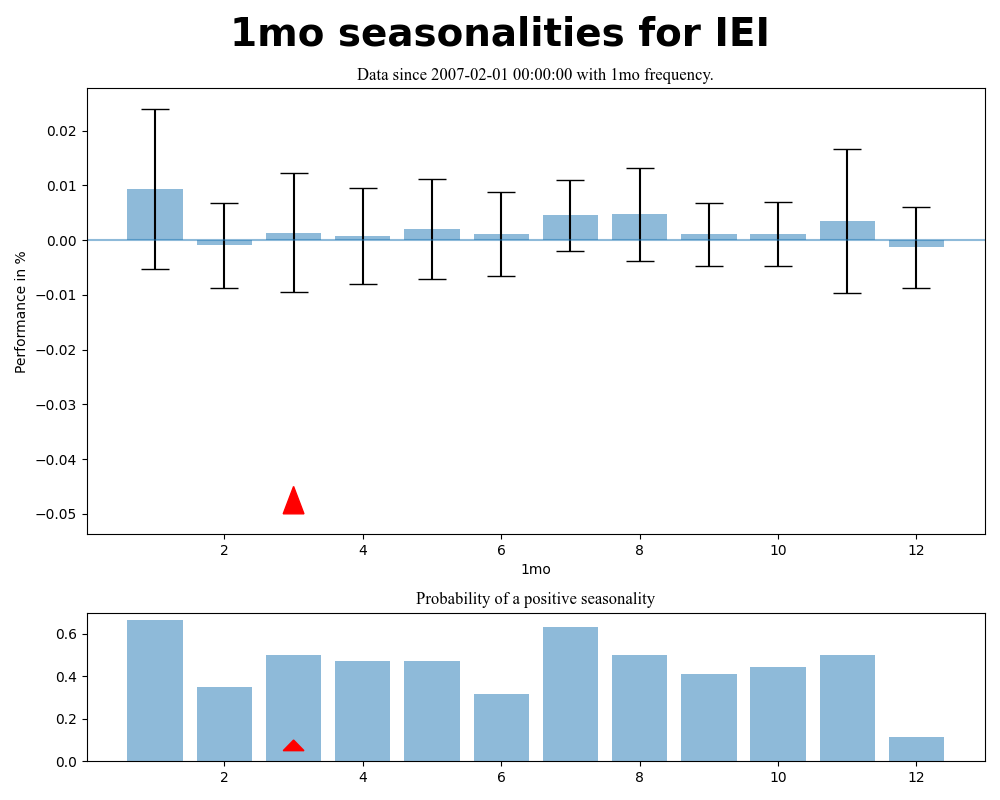
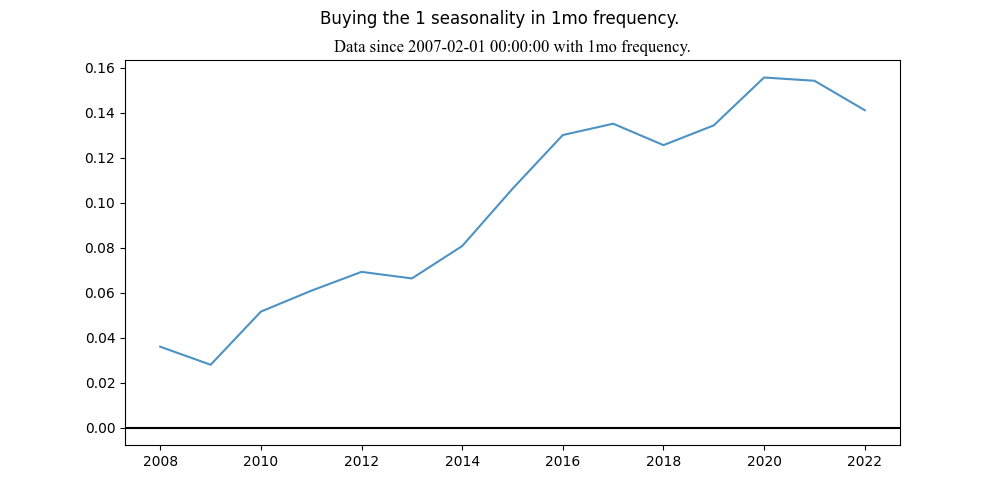
The seasonality plotter shows the seasonality for a specific interval, daily, weekly, monthly, over a chosen period. It also displays a probability for a positive seasonality of that interval and gives the option to simulate a rough backtest.
The tool is packaged for easy import. However, installation is not required, as the main script can be executed on its own. But this way the object can be quickly imported into other programs.
The Data
The tool relies on the data provided by yahoo finance and utilises the package yfinance by Ran Aroussi (PyPI: yfinance). You can therefore load any symbol you can find on yahoo finance (Yahoo Finance).
How to execute
The package can be imported and the class called with the relevant parameters into any project. The following is going to be the stand-alone execution using the terminal or command console.
Navigate to the package folder in your console and run
python src/seasonality\ plotter/seasonality_plotter.py
--symbol “
your chosen symbol on yahoo finance”--interval“1d/1wk/1mo”--period“default: max”--daily“wd/m” (optional for interval 1d)--backtest1/2/3/… (type in the number of the seasonality you want to backtest. Optional)and then press <enter>.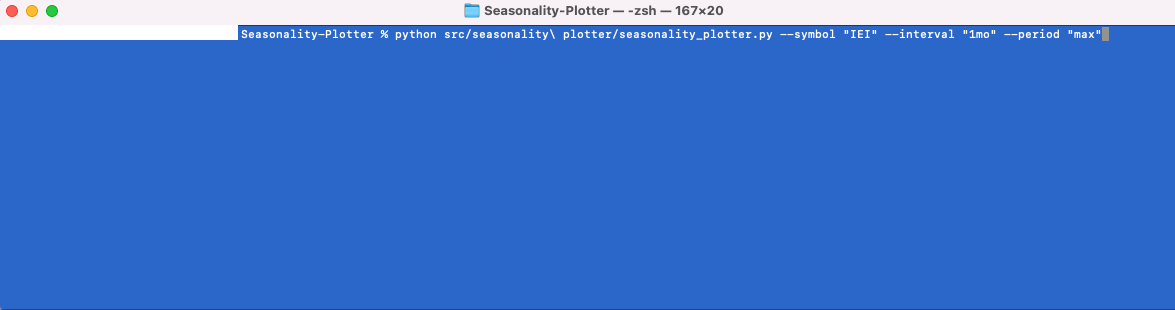
The data will be downloaded and then the plot created.

Close the window. If you added the backtest option, the backtest will open now.


Risks and limitations of the tool
The seasonality and backtest is based on limited quality data and calculation. It is not accurate and cannot be used for investment decisions. The tool is only there to provide a rough idea on possible seasonality trends.
Yahoo data is error prone: Yahoo data is error prone and can lead the program to calculate wrong seasonalities.
The backtest is highly reliant on the time frame provided. The more data provided, the more accurate the result of the seasonality test is.Specific data (e.g. Futures roll): Yahoo data is not cleaned for futures roll. This means that the program shows a large seasonality for assets like Natural Gas futures (yahoo finance ticker “NG=F”), which in reality do not exist, because they are priced over the futures roll.
Backtest does not account for many variables: The backtest is a very rough estimation and does not reflect the reality. For example, it does not account for trading costs (e.g. broker commissions, slippage, bid-ask spread), execution timing (market open vs. closed) or holding costs.
If a higher interval is chosen, then the backtest is made on the higher interval data and does not reflect the daily variation.
This tool is hopefully a good addition to your analysis technique and provides you with helpful insights. If you have suggestions for improvement, please feel free to share them.